
출시Android
QueryDock for IBM Db2
Connect to IBM Db2 databases to explore schemas and run SQL from Android.
제품 정보
About
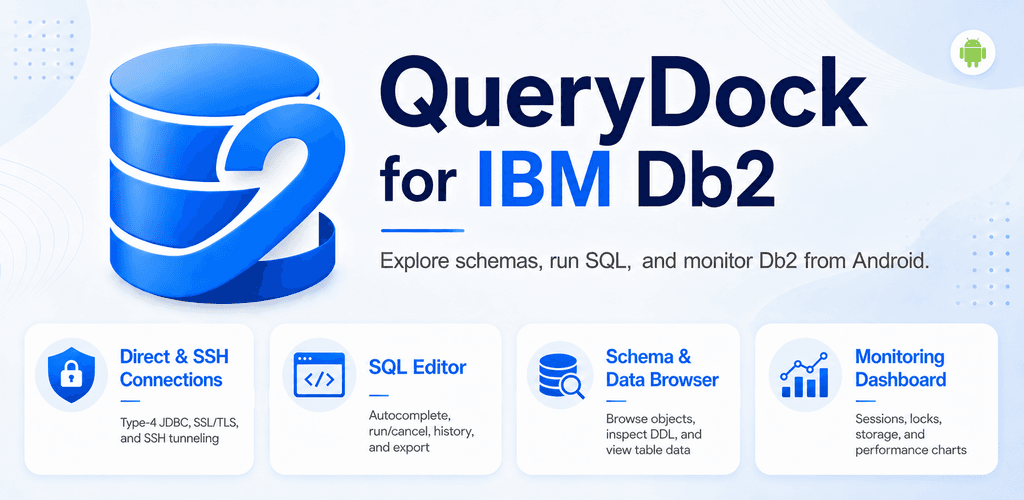
QueryDock for IBM Db2 is a native Android client for IBM Db2. It connects to real Db2 servers over a direct or SSH-tunnelled Type-4 JDBC link using the bundled IBM db2:jcc driver, or explores built-in demo data per profile so every screen works out of the box. Run SQL, browse schemas, view data, and monitor sessions, locks, storage, and performance with Compose-native charts. Built with Kotlin, Jetpack Compose, and Material 3 on an MVVM + Repository architecture, verified end-to-end against Db2 v12.1.5.0 (LUW) with a z/OS-aware catalog that adapts LUW SYSCAT.* and z/OS SYSIBM.SYS* via a CatalogDialect abstraction. This is an independent tool and is not affiliated with or endorsed by IBM.
Features
- Live connections via Type-4 JDBC (direct or SSH tunnel) or a built-in demo data source per profile, with a Db2 family selector, connection test, SSL/TLS, favorites, and a connect-time password prompt for profiles whose password isn't saved
- Encrypted connection profiles (Android Keystore); connection and SSH passwords kept in EncryptedSharedPreferences, never in plain profile storage
- SSH tunnel via local port-forwarding (JSch) with encrypted-at-rest SSH credentials, for Db2 hosts reachable only inside an SSH box
- Multiple concurrent connections with an active-connection switcher and per-profile connection caching with stale-connection self-heal
- SQL editor with Db2 keyword highlighting, live-catalog autocomplete, run/cancel, query history, read-only mode, and destructive-statement confirmation; results as grid, auto-suggested chart, or info, with export
- Schema browser: schemas → tables/views/indexes/routines → columns, indexes, and DDL; view data with a side-by-side detail pane on tablets and foldables
- Paginated, horizontally-scrollable table-data grid with a pinned first column and cell detail
- Dashboard & Monitor: overview cards, tablespace usage, session distribution, lock waits, buffer-pool hit ratios, top SQL, and throughput — visualized with bar, donut, gauge, line, and sparkline charts
- Home-screen Jetpack Glance widget showing the active connection's alias, status, session count, and table count
- Settings: theme (system/light/dark), language (Korean/English), biometric app lock, read-only default, and result page size
설치 및 실행